Your report will address AFM methods you have seen, each procedure with visual (picture ) examples, and the comparison of size measurements for QD between AFM and one of other methods: absorption emission, DLS, etc .For DLS see experiment , for Absorption see textbook Experiment 45 and the empirical formula for radius.
0) Lecture before experiment 2a 2b
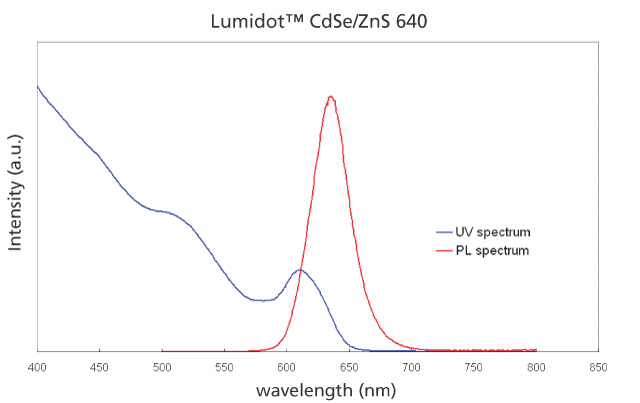
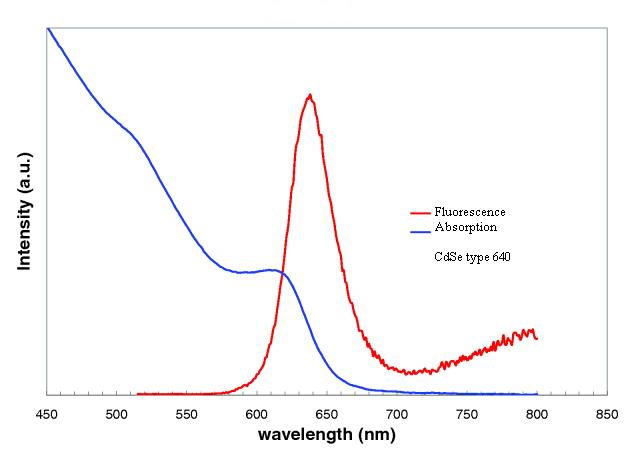
1) Absorption and luminescence spectra of QD (CdSe/ZnS) Calculation
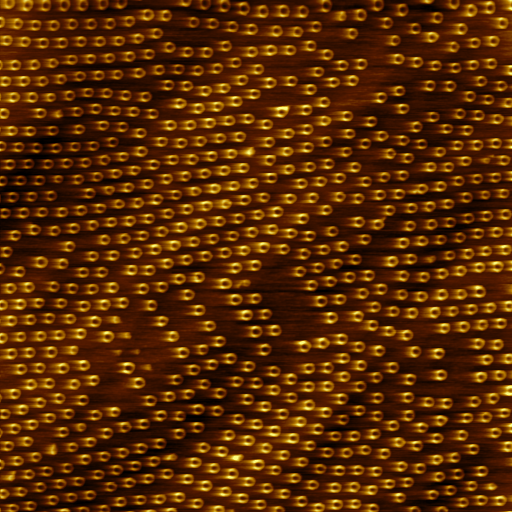
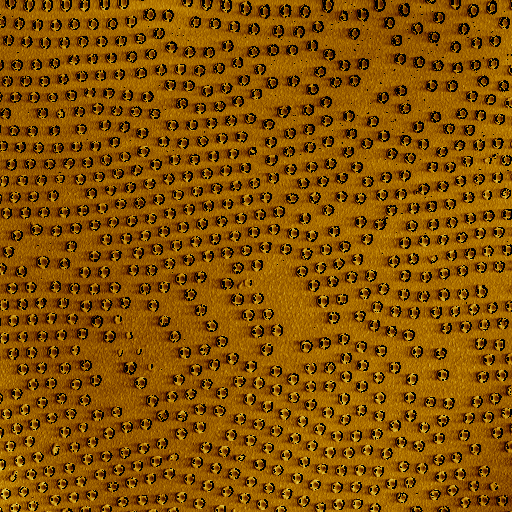
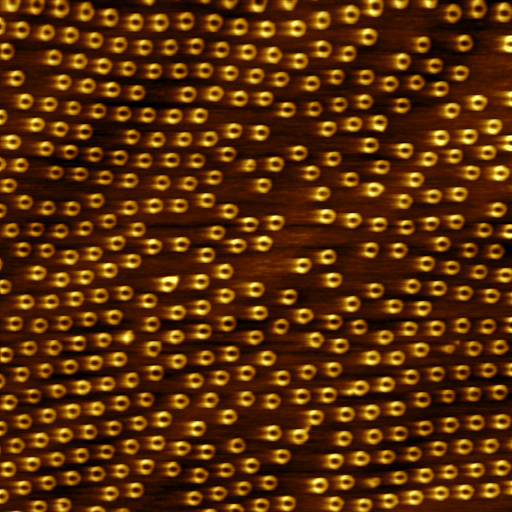
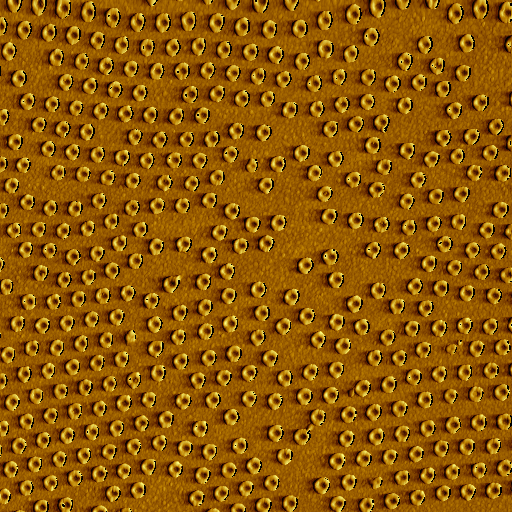
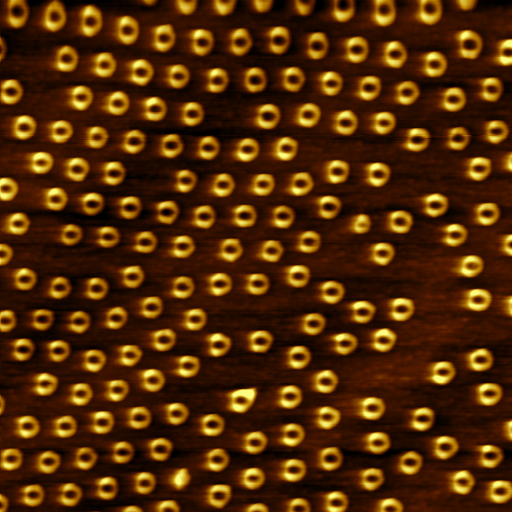
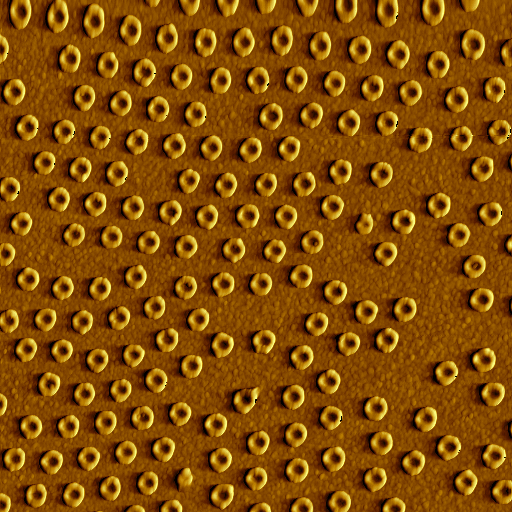
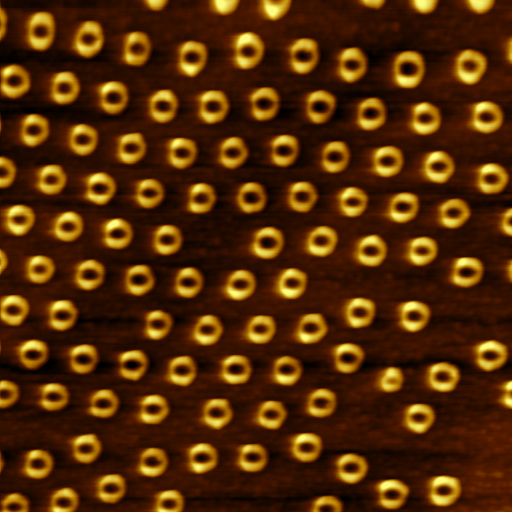
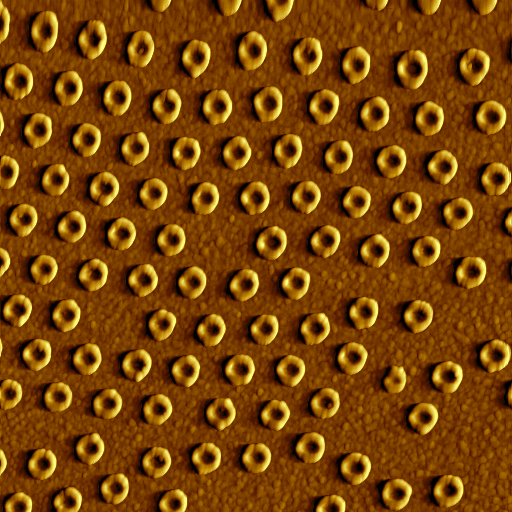
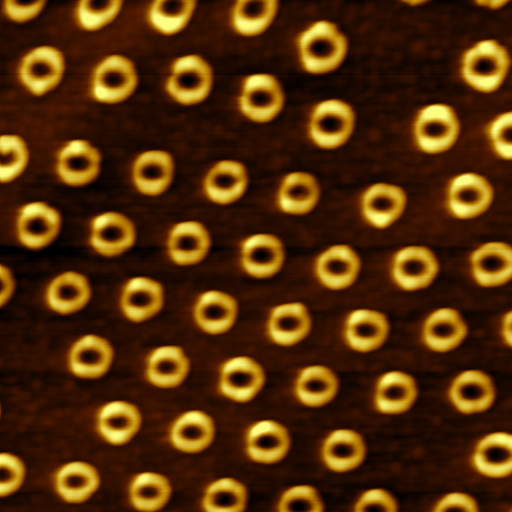
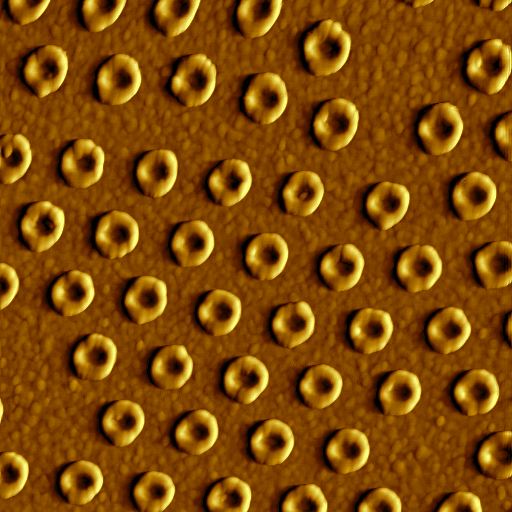
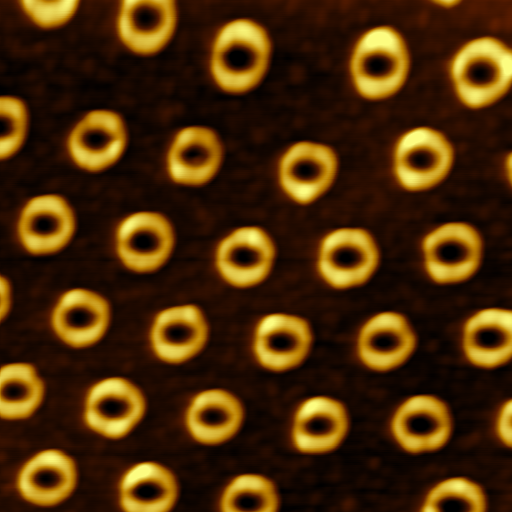
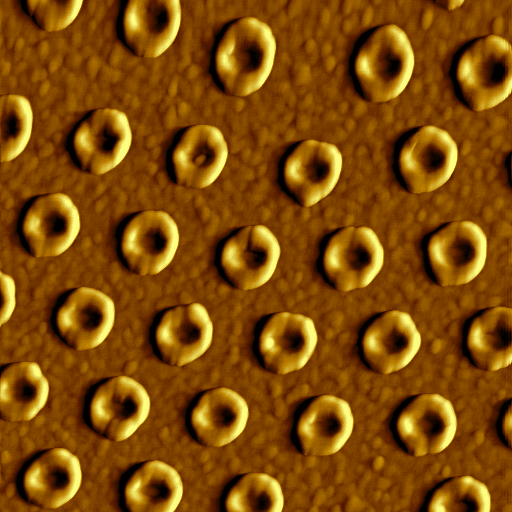
2) Experiment 6 (AFM-STM) -web site support
4) Fall 2001 AFM
CVD PEG 1 2 3 4 5 NG NS Thiol: 1 2
Data analysis using Gwyddion + FFT and autocorrelation
You will probably need to install Gtk+ runtime environment prior to Gwyddion installation. We recommend GladeWin32 Gtk+ runtime environment.
| Win32 installer: | Gwyddion-2.22.exe | ||
| Win32 developement installer: | Gwyddion-Development-2.22.exe |
Note you don't need to install Gwyddion-Development to just use Gwyddion.
WHAT TO DO:
File _> Open (choose you file from the data above
Meta_> Show Data Browser ( choose channels: topography, amplitude, phase..
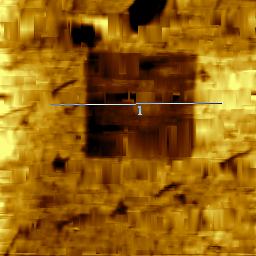
You can find the sizes from (topography file)
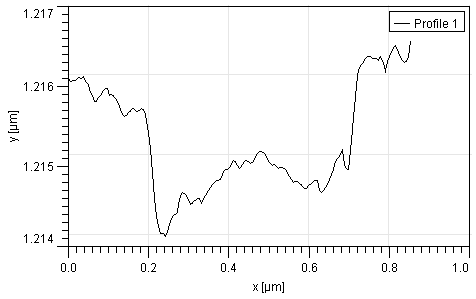
Tools -> Extract profile (icon ) Note: this one can be in nm.
Distances:
Tools-> Measure distances
--- Filtering
Data Process-> Correct Data-> 1D (or2D) FFT Filtering (Choose domains you want to test in the inverse FFT space, check the shapes in the resultant graph)
ETC.
-----------------------------------------------------------------------------------------------------------------------------------------------------------------------------------------------------------------------
old material:
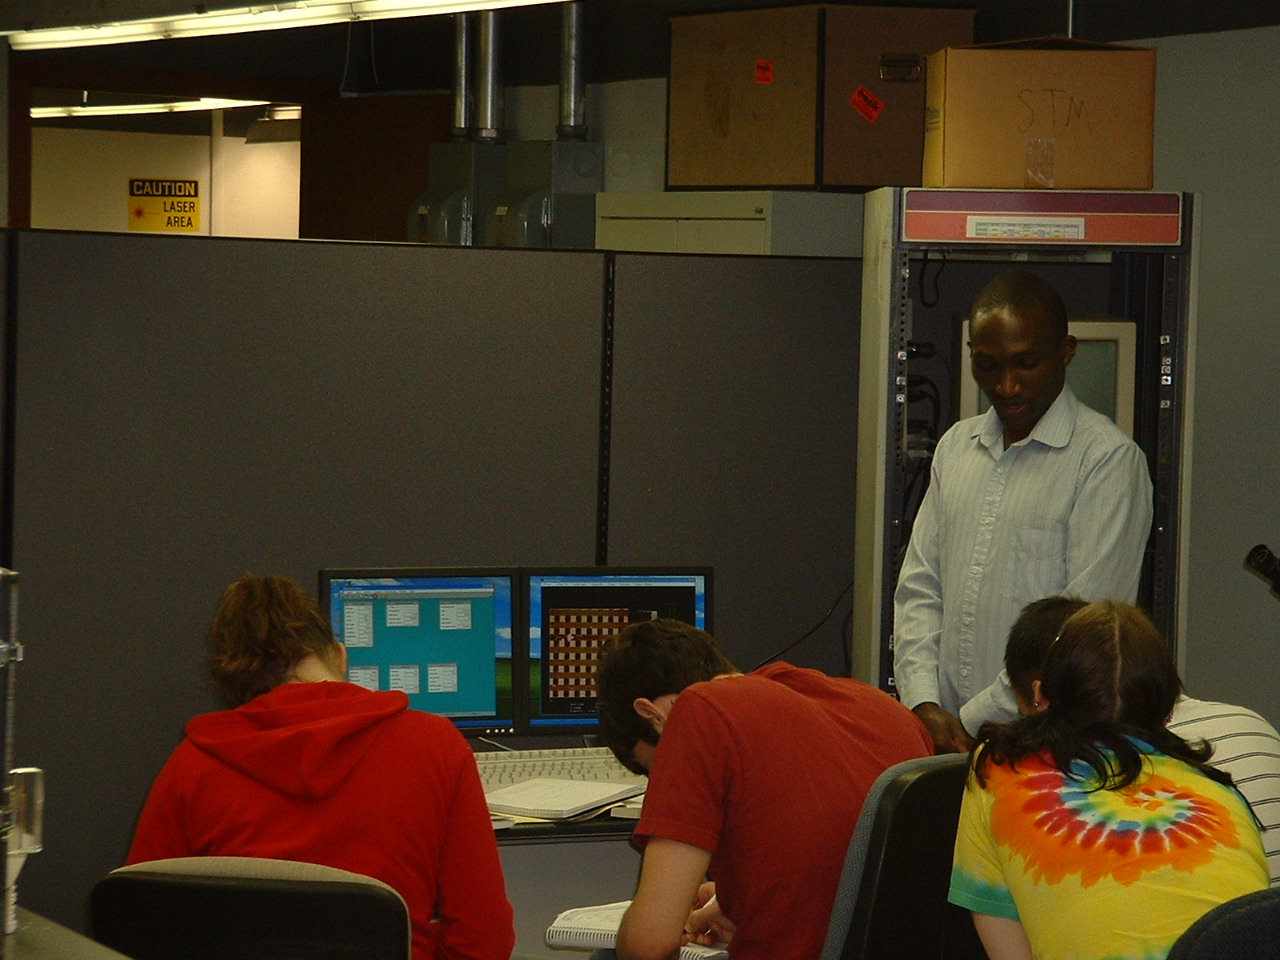
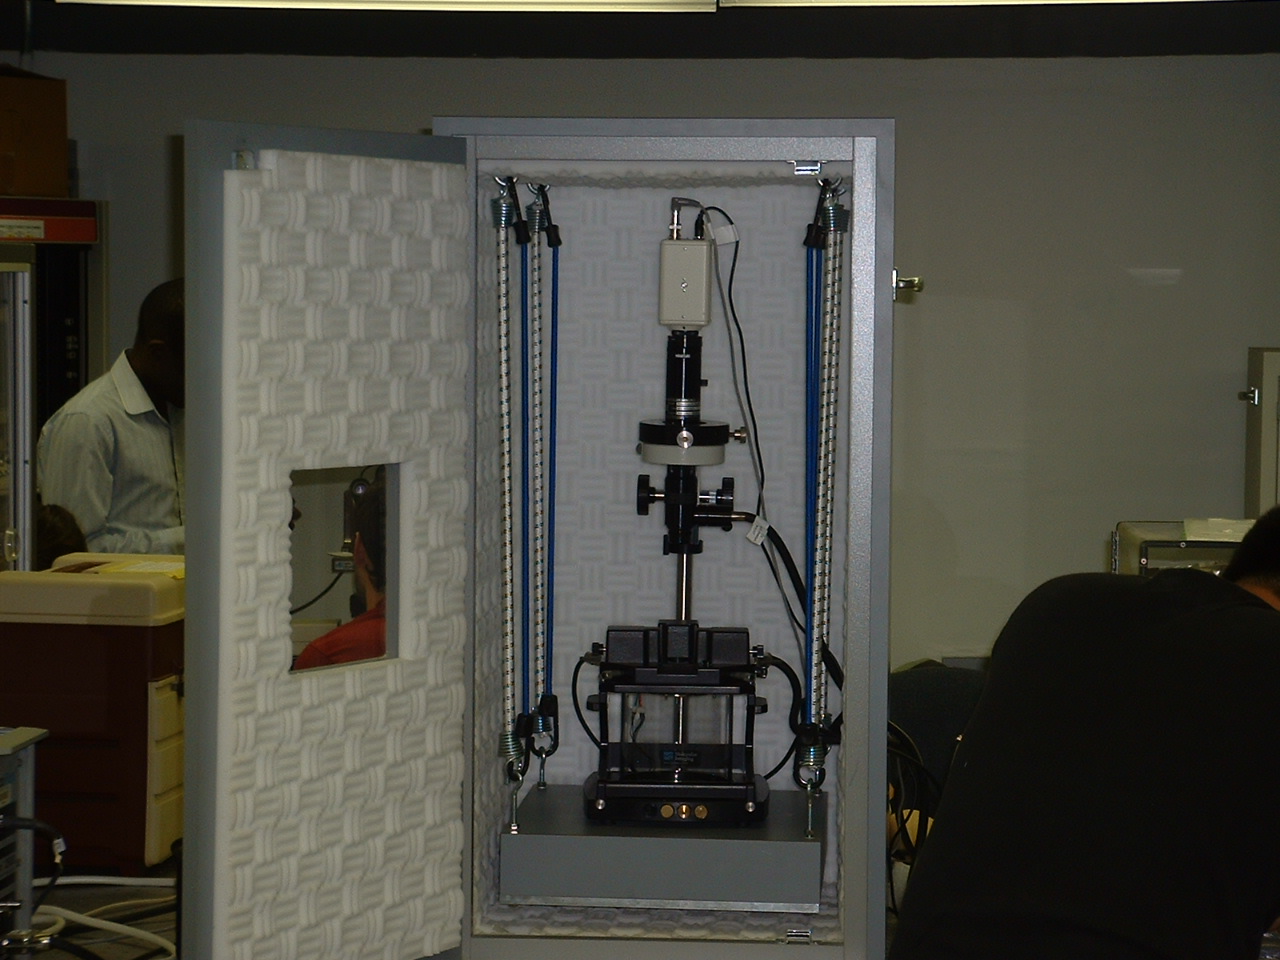
Monday is AFM lab, !:40PM sharp. Go to the basement of Chem department Choppin hall -big doors near freight elevator. - See Experiment 6. Download Gwyddion on your computer (free see instructions) for AFM imaging and visualization. The work in AFM lab demands patience - take notes and spend time usefully writing and thinking about the work. The AFM project will have a PPT presentation part.
(AFM results 08 spring and AFM results fall 08 1 2 3, last semester: AFM Results spring 09 (very good!) and results fall 09 Procedure: 1 INTRODUCTION : 2)
raw files 2011 CdSe NC: 1 2 3 4 5 6 7 ppt Absorption & Fluorescence (material for AFM report)
data 2010
raw files 2011 CdSe NC: 1 2 3 4 5 6 7 ppt Absorption & Fluorescence (material for AFM report)
----
goals (2010 Iron Oxide) 2 3Dates: .... and ....... AFM experiment - Choppin basement B-1, sharp 1:40PM, reports due on Monday, ..........
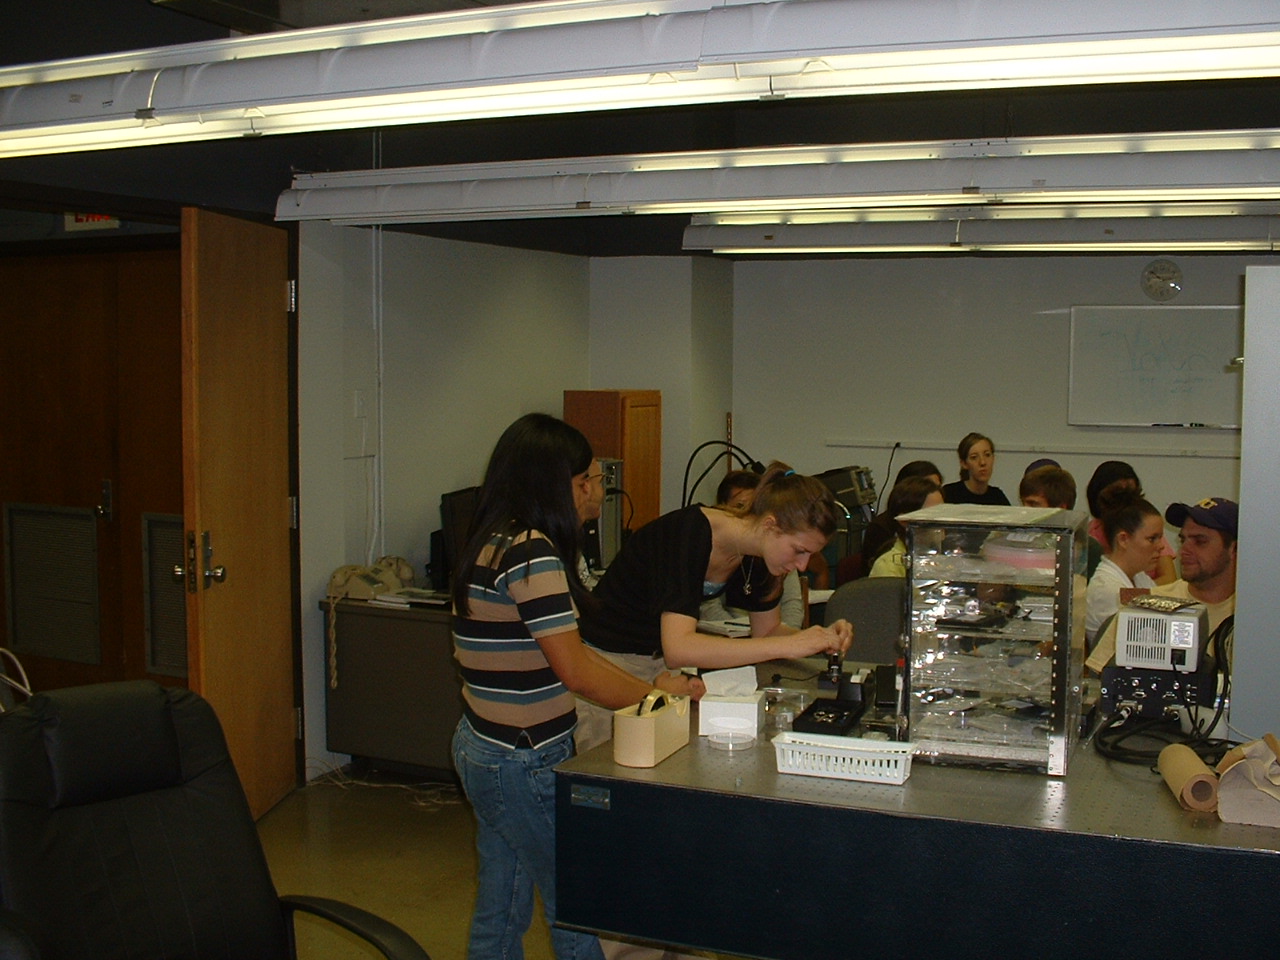
pictures from the AFM lab (2009)
Last year (2009) research:
group1-day 1
group 2-day 1
Photos: 1 2 3 4 5 6 7 8 9
From spring 2008: Experiment -read this before class